course_dv
Tableau Interface
This module covers the Tableau interface, including how to install Tableau, navigate the interface, and understand key features. We will make some basic charts to get familiar with the software.
Outcomes:
- Connect to an Excel or CSV file
- Explain the differences between the two formats
- Identify key interface elements
- Save a Tableau workbook correctly locally or on Tableau Public
- Identify common data types, including text, integers, floats, money, dates, and booleans
- Differentiate between dimensions and measures
- Differentiate between discrete and continuous fields
- Select among different aggregation functions, including average, sum, count, max, and min
- Create a basic table
Links:
- See Datacamp Introduction to Tableau
- Quizlet
Installation
Before class, install Tableau on your computer:
- Download the latest version of Tableau Desktop
- Click on the link above and select “Download Tableau Desktop”. On the form, enter your school email address for Business E-mail and enter the name of your school for Organization.
- Activate with your product key: See eCampus for key
- Already have a copy of Tableau Desktop installed? Update your license in the application: Help menu → Manage Product Keys. Make sure that you are fully up to date with the latest version.
Interface
- Data pane for looking at data
- Sheets/pages
- Canvas for your vis
- Filters to limit (either upper-left or right panel)
- Mark cards are used to change how data is displayed
- Buttons
- Undo/Back
- Show me button
- Clear sheet
- Control+click to copy a pill
Saving
Be careful how you save your file! Normal Tableau files don’t include the data. You must save as a packaged workbook for any submitted work in this class.
We share our data with Tableau Public. This makes our information and visualizations public. Do not use Tableau Public for any sensitive or private data.
Data
We start by connecting to a data source. Tableau can connect to many different data sources, including databases, spreadsheets, and flat files. For this class, we will primarily use Excel and CSV files. Tableau can also connect to databases, but that is outside the scope of this class.
Data sources:
- Excel: multiple-sheets + formatting
- CSV: comma-separated-values, no format or sheets.
Once you connect to a data source, Tableau will show you a preview of the data. You will generally need to do some basic data cleaning before you can start visualizing the data. Common tasks include:
- Remove unnecessary fields
- Rename fields
- Change datatype of a field
Data Types
Each field can hold different types of data.
Some common data types include:
Textare strings of characters (like names, categories)Integersare number without a decimal point valueFloats/doublesinclude information past the decimal pointMoneyis a type in some databases. It is an integer that records the number of pennies, which solves some problems with doubles/floatsBooleanare True or False valuesDatesare a special type that records dates. Tableau can parse many different date formats, but they must have a day, month, and year. You can also hold time.Geographicaltypes include country, state, county, city, and zip code. Tableau can use these to create maps.
Dimensions and Measures
One of the most critical things to understand in Tableau is the difference between dimensions and measures.
Dimensions are fields that are used to slice and dice data. They are typically discrete values, such as categories or names. Dimensions are used to group data and create headers in tables.
Discreteare blue pills are discrete categories (like id number, neighborhood)Continuousare green pills are continuous ranges (like room price)
Measures are fields that are used to aggregate data. They are typically numeric values, such as sales or quantities. Measures are used to calculate totals, averages, and other statistics.
- Average can have multiple meanings
Modeis the most common itemMeanis sum / countMedianis middle item when sorted large/small
- Others functions include:
Countsummaxmin
We commonly use discrete measures and continuous dimensions. However, this is not always the case. You can change a dimension to a measure by right-clicking on the field and selecting “Convert to Measure”. Similarly, you can change a measure to a dimension by right-clicking on the field and selecting “Convert to Dimension”.
Table
To create a table in Tableau, drag and drop fields from the Data pane to the Rows and Columns shelves. You can also use the Show Me panel to quickly create a table.
A table is not chart unless you also use pre-attentive attributes to map data to visual features. For example, you can use color to represent different categories or size to represent different values.
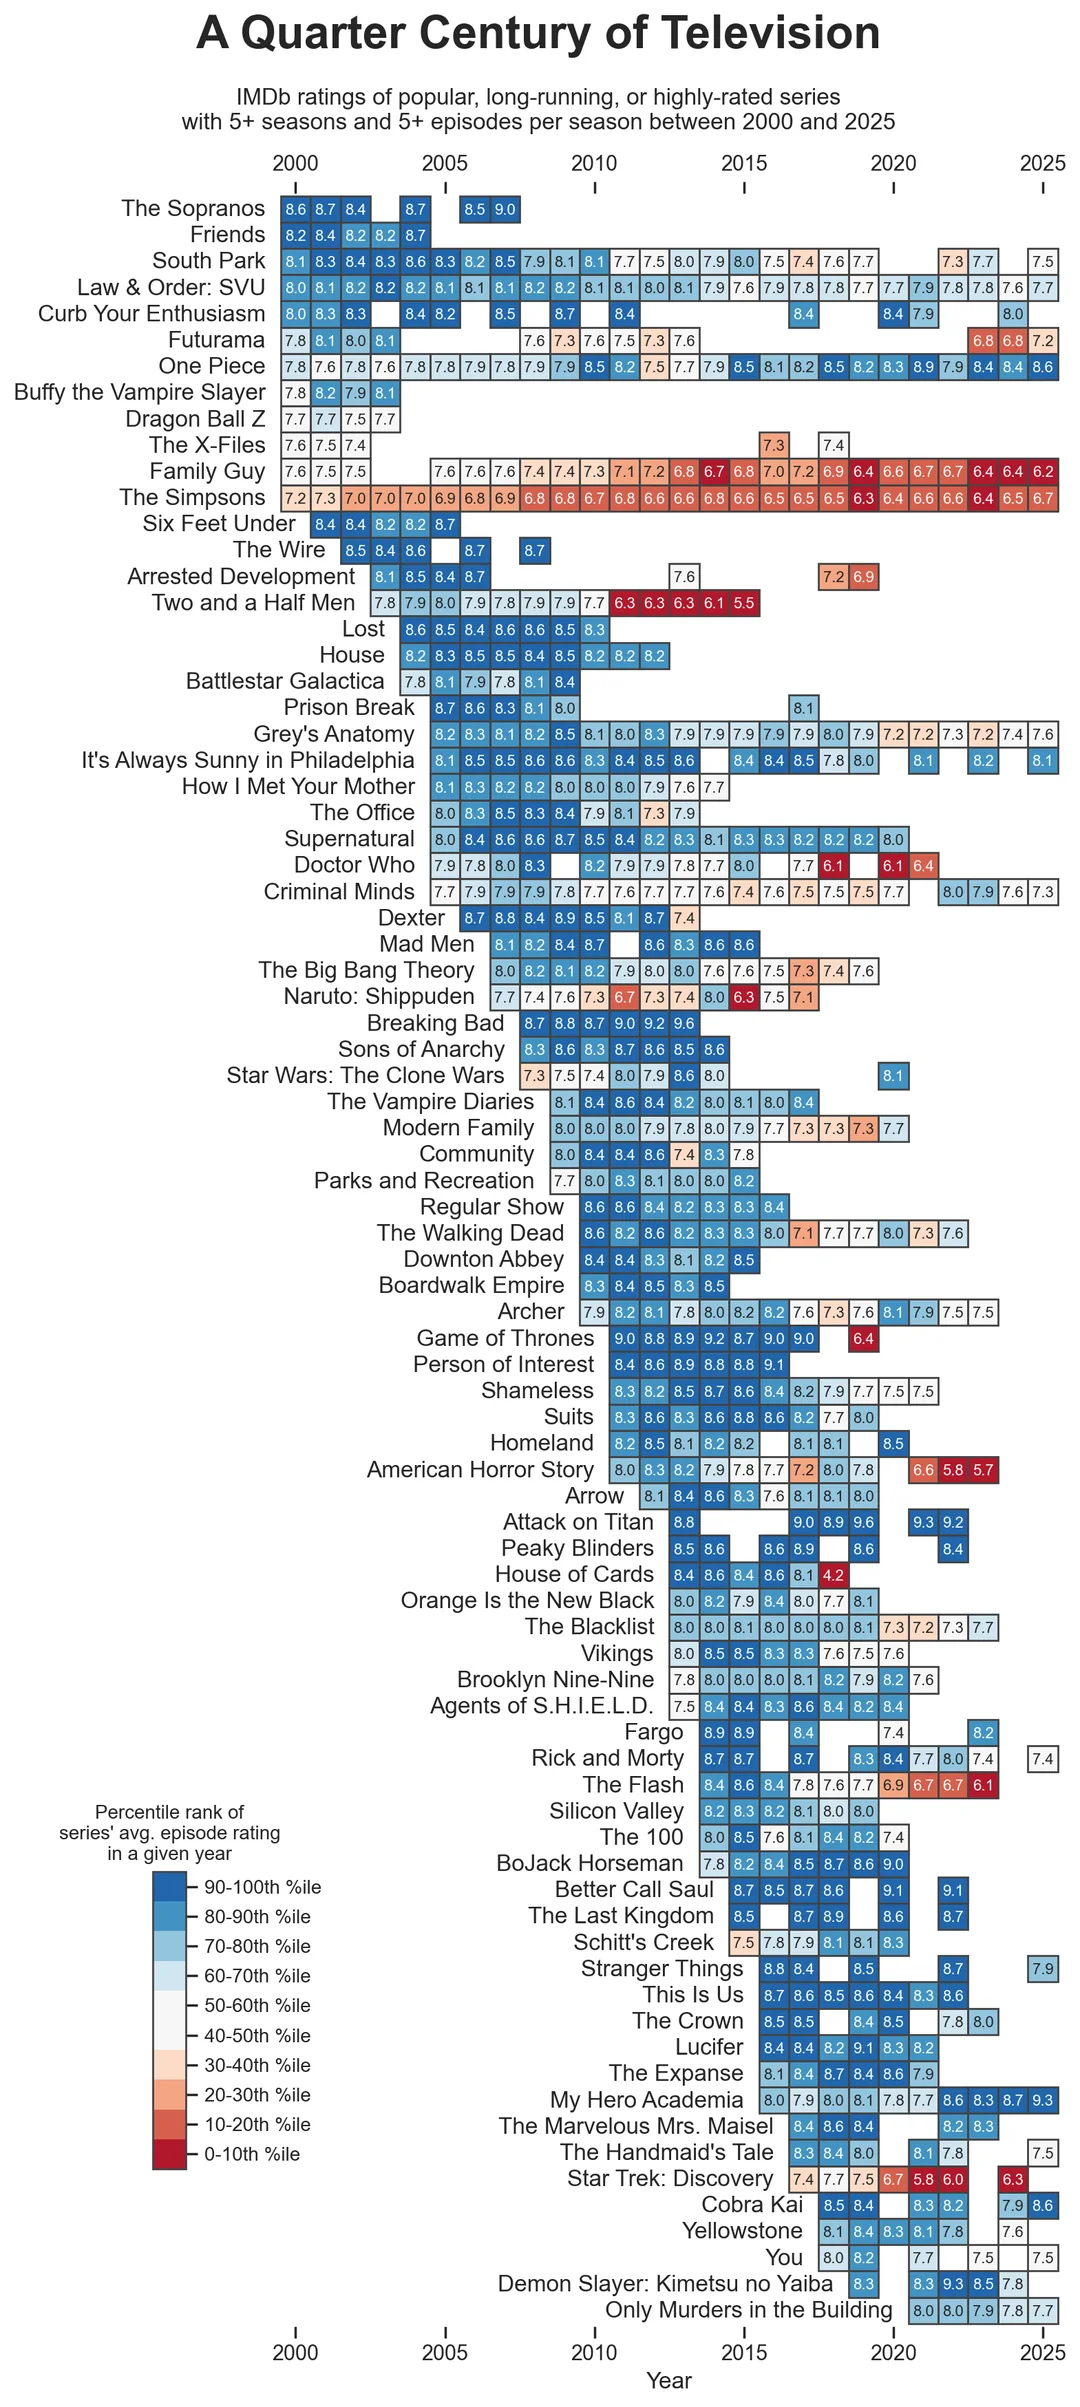 Source: https://www.reddit.com/r/dataisbeautiful/comments/1qaq7kz/a_quarter_century_of_television_oc/ by gammafission00