Tableau
Sample data
City of Chicago Data Portal
NPS API - https://www.nps.gov/subjects/developer/api-documentation.htm
Sample Data Presentations
Are songs becoming more negative?
Sample Dashboards
Sample Charts
http://wdi.worldbank.org/table/WV.1
Fourth-grade math scores fell for all groups from 2019 to 2022, but this change was more pronounced for students of color
School Bullying https://www.smartick.com/data/decoding-school-bullying/
Degrees With Dividends: Ranking the Bachelor’s Programs with the Highest ROI in America https://brokescholar.com/bachelors-programs-with-the-highest-roi-in-america
Good maps https://www.reddit.com/media?url=https%3A%2F%2Fi.redd.it%2Ftfxtvd3yglgc1.png
Cost of living https://www.reddit.com/r/dataisbeautiful/comments/1chnovz/oc_cost_of_living_by_county_2023/?share_id=f-J9xwy8naRLE4boIdUlI
How does a Pizze place make money? https://www.reddit.com/r/dataisbeautiful/comments/1dy4usi/oc_how_a_pizza_place_makes_money_proforma/?share_id=SGHNuW1mkwtP3ItquUqxq
Poverty Rates https://www.visualcapitalist.com/mapped-poverty-rates-by-u-s-state/
Tips
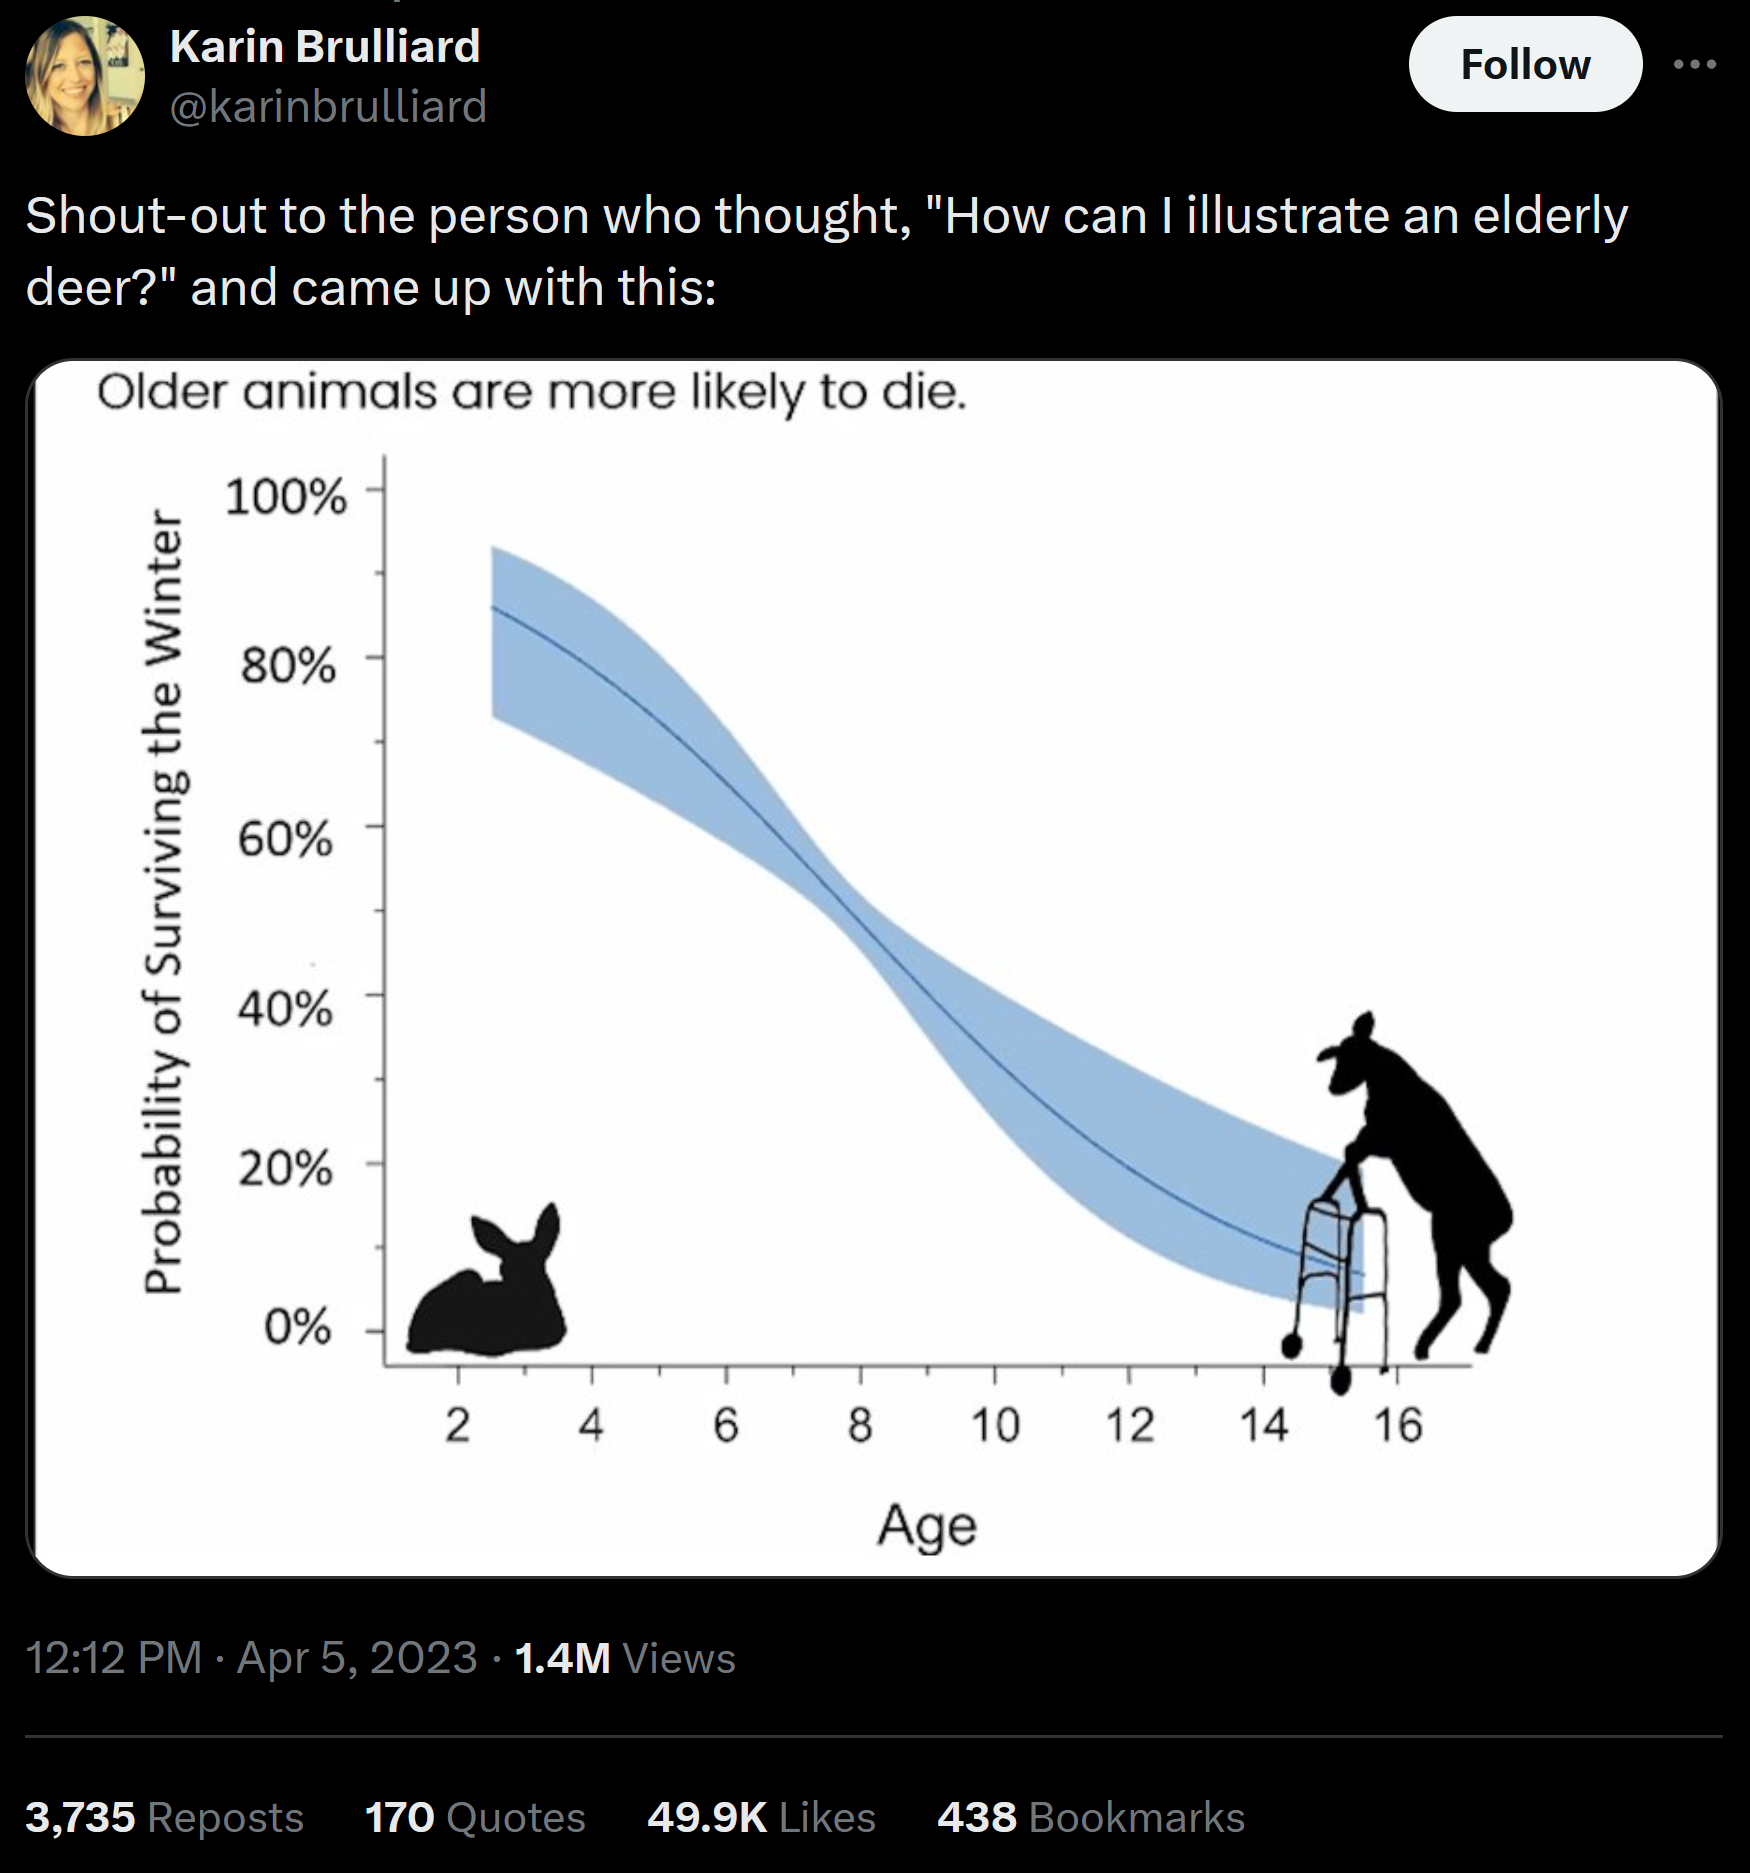
Make the title match the message in the graph